
Early afternoon January 28, 1986, and the editors of USA TODAY were gathered around a table trying to figure out how to cover a story that rocked the world an hour before.
I was one of them.
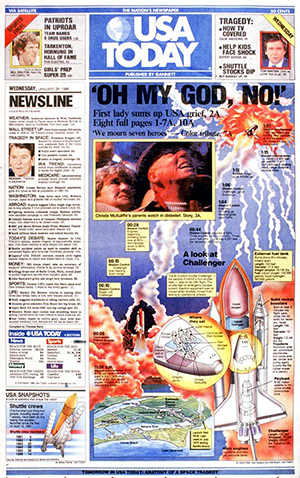
The space shuttle Challenger had exploded 73 seconds after liftoff. Other newspapers were sure to produce columns and columns of type, and photos of the explosion.
But was this the most efficient, clearest, and informative way to tell this story?
We thought not.
We would tell the story visually, devoting the entire front page to a giant infographic, the first of its type, telling the Challenger disaster from launch though its short journey to disaster over the Atlantic.
If a picture is worth 1,000 words, an infographic is worth at least 10,000.
Now, more than 30 years later, marketers are embracing infographics. Among those using infographics, 67 percent say they are one of their most effective communications channels.
Infographics are not only visually appealing and engaging, but can be easily shared in person or on social media.
smartworks has created infographics for many of its clients, including to:
But creating an effective infographic is not as easy as slapping some graphics on a blank piece of paper. It takes skill, experience and a keen sense of storytelling.
Some companies sell generic infographic templates, but are almost always less effective than custom creating one for your specific needs. They require manipulating your story into their pre-made designs.
The process for creating an effective infographic includes:
Then, there are other details; sizing, backgrounds, colors (which evoke different emotions and responses), and many others.
Or, you can contact smartworks and we will custom create an infographic, guaranteed to be effective, comprehensive and compelling.
For more information contact Tony Casale at acasale@smartworksco.com or 609-912-6350.
Stay connected Fill out the form below to ensure you receive this and future smartworks content; or, recommend other topics.